Maps have seemed to go the way of the dinosaur. No longer do we fumble in the car with a folded up piece of paper. Smart phones and navigation systems have freed drivers up and made the roadways safer. But that does not mean that maps are completely obsolete. Nostalgia for the past, as well as the efforts modern artists, have given mapmaking new respect.
Dave Imus
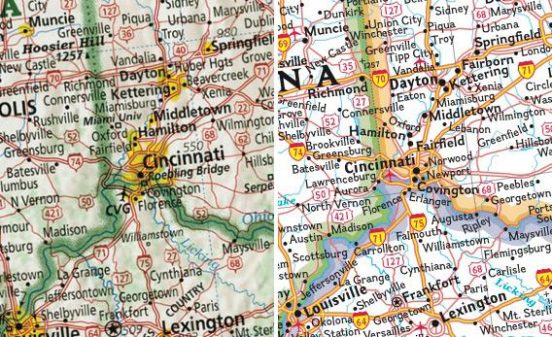
Working alone in a small house in rural Oregon, Dave Imus is one of America’s best cartographers. Imus is driven to improve upon the maps he experienced as a child, which he said lacked clarity, depth and enough information to truly foster geographic literacy. Imus has worked in the field for over 35 years, but it’s his map “The Essential Geography of the United States of America” which has defined his career. The large wall map took him two years of intensive work(over 6,000 hours) to create. Rather than emphasizing state border lines, Imus shades in the natural phenomena that create the boundaries. This example of Cincinnati defined by the Ohio River gives you a glimpse of how Imus sees the world.
Levi Westerveld
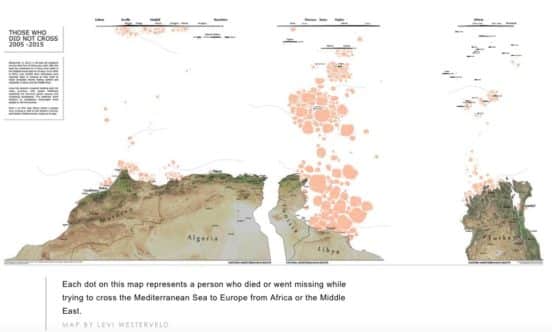
Levi Westerveld is a Dutch/French artist who was inspired to create more emotionally human maps by the plight of refugees. Working with data of the number of people who attempted to cross the Mediterranean Sea from Africa to Europe, he plotted dots in the places where every person died. Westerveld map gives a visual experience to the numbers of people who died in sinking boats escaping catastrophes, illuminating the experience. His map, “Those Who Did Not Cross,” has been an award-winner for its humane treatment of a difficult subject.
Chelsea Nestel
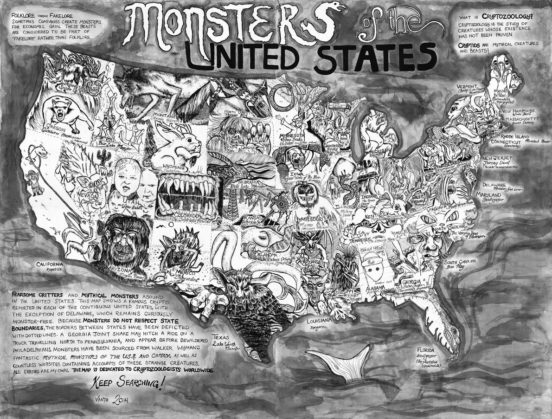
Phd candidate Chelsea Nestel was inspired to create a map of mythical creatures in a unique way: by the Bobby Pickett song “Monster Mash,” which chronicles a party of monsters. Nestel created a map called “Monsters of the United States,” which depicts the most fearsome mythological monster in all 50 states. Now legends like the Jersey Devil, Pukwudgie, Frogman, Skunk Ape and Tessie are given their due. Nestle’s interests include comics as cartographic experience, traditional cartography and experimental graphic design.
Jeremy White
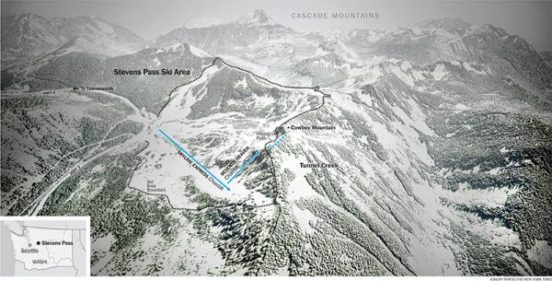
Snow Fall is a New York Times feature that immediately went viral back on December 20, 2013. The feature was a multimedia story about an avalanche in Washington’s Cascade Mountains. The photographs, videos and stories were supplemented by 3-D flyover maps created by Jeremy White. The cartographer and NYT editor created three key maps: the first showing the mountain, the second displaying each person’s journey, and the last showing how each person went down the mountain. White built the 3-D models by incorporating data from King County GIS Center in Washington, which he combined with elevation data from the United States Geological Survey. The painstaking process also involved using satellite photos from the USGS to add texture, which he topped with fake snow. The YouTube video outlining his process was also a sensation.