

Many people don’t like analytics because they don’t understand how to work with it and why it is necessary. Analyzing the data can be a challenge, and entrepreneurs simply give up on funding it not seeing a profit. Actually, as reported by Akveo, using analytic software helps your company raise the sales up to 20%.
And you don’t have to hire an entire analytics department. Thanks to the technologies, you can do any analysis within a single program and its tools.
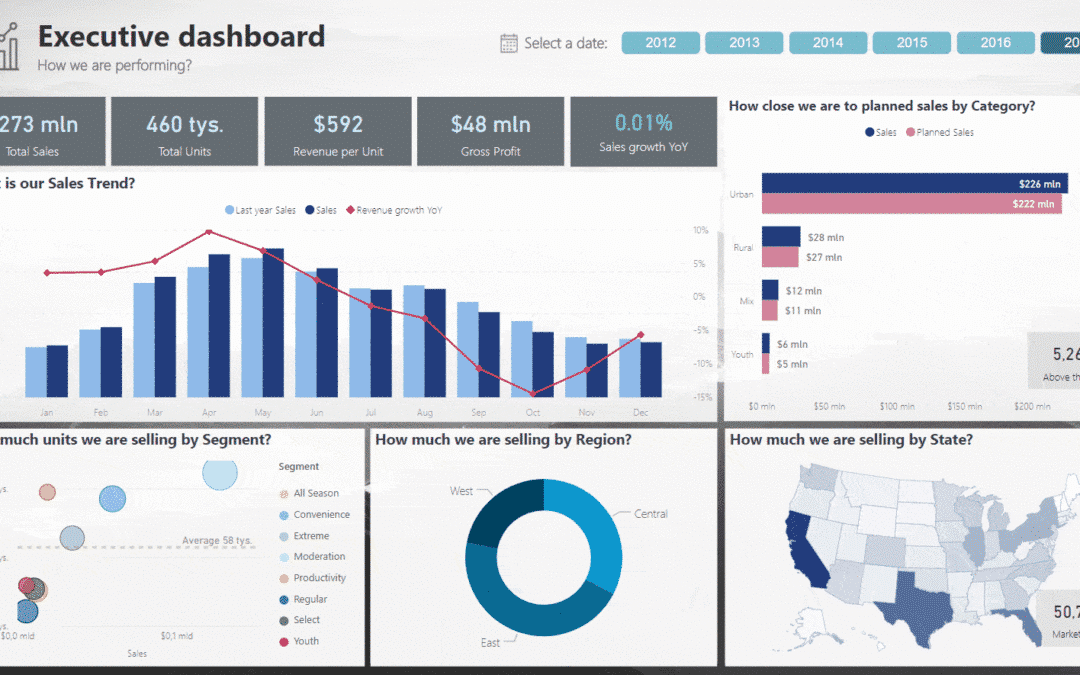
You can see how a simple analytics program can make life easier for any business. Microsoft Power BI system is a perfect example. Regardless of the field, your business operates in, of course. But the most significant benefit BI system and its tools bring to the companies that need delivery management.
What is Power BI?
Business Intelligence systems are analytical systems that combine data from various sources. Then they transform it and present it in a visual form that is convenient for analysis. BI technologies allow processing large unstructured amounts of data. That helps the company’s management to make business decisions.

Power BI is a set of Microsoft software services. They work together to transform a company’s unrelated data sources into interactive reports. In this case, the source can be databases or Excel files. The services also support data from cloud sources and the Internet, text files, and so on.
As soon as you configure the connection to data sources reports will be generated automatically. And you no longer need to waste time creating separate reports.
The scope of Power BI usage depends on your company’s needs. There is an incredible range of opportunities for business analytics. For example:
- you can use Power BI to automate the creation of interactive financial reports;
- you can also allow the viewing only for particular department in a company;
- you can create a power bi dashboard that will help you to process the shipment of all your orders.
Power BI Dashboards
What is a BI dashboard? The dashboard in Power BI is the final element not only in workspaces but in the architecture of Power BI. This is the semantic tip of all end-to-end analytics. Basically, everything starts with disparate data. Later it is processed and combined into a single information model (data sets).
Afterward, you can build various reports on the basis of this data. You can visually combine these reports on one canvas. This canvas containing visualization tiles from different reports is called a Power BI dashboard.
The main meaning of this dashboard is to display the most important metrics for observation, comparison, and control on one screen. Also it easies the navigation. When you click on each metric on a specific dashboard, it brings you to the corresponding expanded Power BI report.
Thus, dashboards are part of the Power BI Service workspaces. Each individual dashboard can only belong to one workspace. But at the same time, it can be based on visualizations from many different reports or datasets. Still, located within only this particular workspace. If you are the creator of the dashboard, then you will have access to all reports and data sets that are used in the BI dashboard.
If other users have shared the dashboard in Power BI with you, then viewing and editing reports will be available to you. Of course, depending on the rights that other users have given you about this dashboard. In a standard situation, the report will be available to you only for viewing. But if you are given the appropriate rights, then access will also be available for editing.
How To Create A Dashboard?
Before creating a dashboard, you need to upload the necessary data into the Power BI and create the reports.
Getting the data
If you want to get the data from Excel, you need to click on the main page “My Workspace” and then “Get Data”. Select the file you want to upload and click on “Import”.
If you want to upload the data from Google Analytics to the Power BI, it is as easy. On the “Home” tab in the “External data” group, click on the “Get data” button. After that, in the “Get data” dialog box in the “Other” group, select the “Google Analytics” service and click “Connect”. Then you need to log in into your Google account and allow to view the data in Google Analytics.
In the “Navigator” window that opens, you will see a list of all available Google Analytics accounts and resources. Each account contains the same set of parameters and indicators, divided into 28 groups. There is a limit on the number of parameters requested (no more than seven) and metrics (no more than ten).
To load the selected data into the Power BI Data Model, click the Load button. You can find it in the lower right corner of the Navigator window.
Editing the data
After all the necessary data has been loaded, it is necessary to bring them to the optimal form. The most convenient way to edit data is to switch to the “Data” mode using the command of the same name located on the left pane of the Power BI working window. In data mode, you can change the type of data stored in any column, create new columns and measures. In general, you can do whatever you want with the data.
After this step, click on “Edit the report”. Now, you can visualize the uploaded data in the dashboard form.
Creating a Bi-Dashboard
You can create Power BI dashboard by clicking the “Pin visual element” button inside the reports. Also, by clicking the “New / Dashboard” button located in the upper right corner in the workspace section.
Next, you need to choose where you want to pin the selected item to an existing or new dashboard. Any dashboard you create can be shared using the Share button located in the upper right corner of the menu of each dashboard you create.
When you select the Dock option, Power BI creates a dashboard in the current workspace. When the Docking to Dashboard message appears, select Go to Dashboard. If you want to save the report, select Save.
Power BI opens a new dashboard. It will present one tile (the visualization just pinned). Click the tile to return to the report. Pin some more tiles to the new dashboard. When the Pin to Dashboard window appears, select the Existing Dashboard option.


